Defence and its impact on goals
Intro
In this first post of mine I will try to show what impact defenders have on the chance of a goal being scored. If you read this, you almost certainly know what expected goals are. If not @11tegen11 explains it well here. Rather than just performing some sort of correlation test and draw conclusions from that I build a bunch of expected goal-models using logistic regression with different combinations of predictors or features.
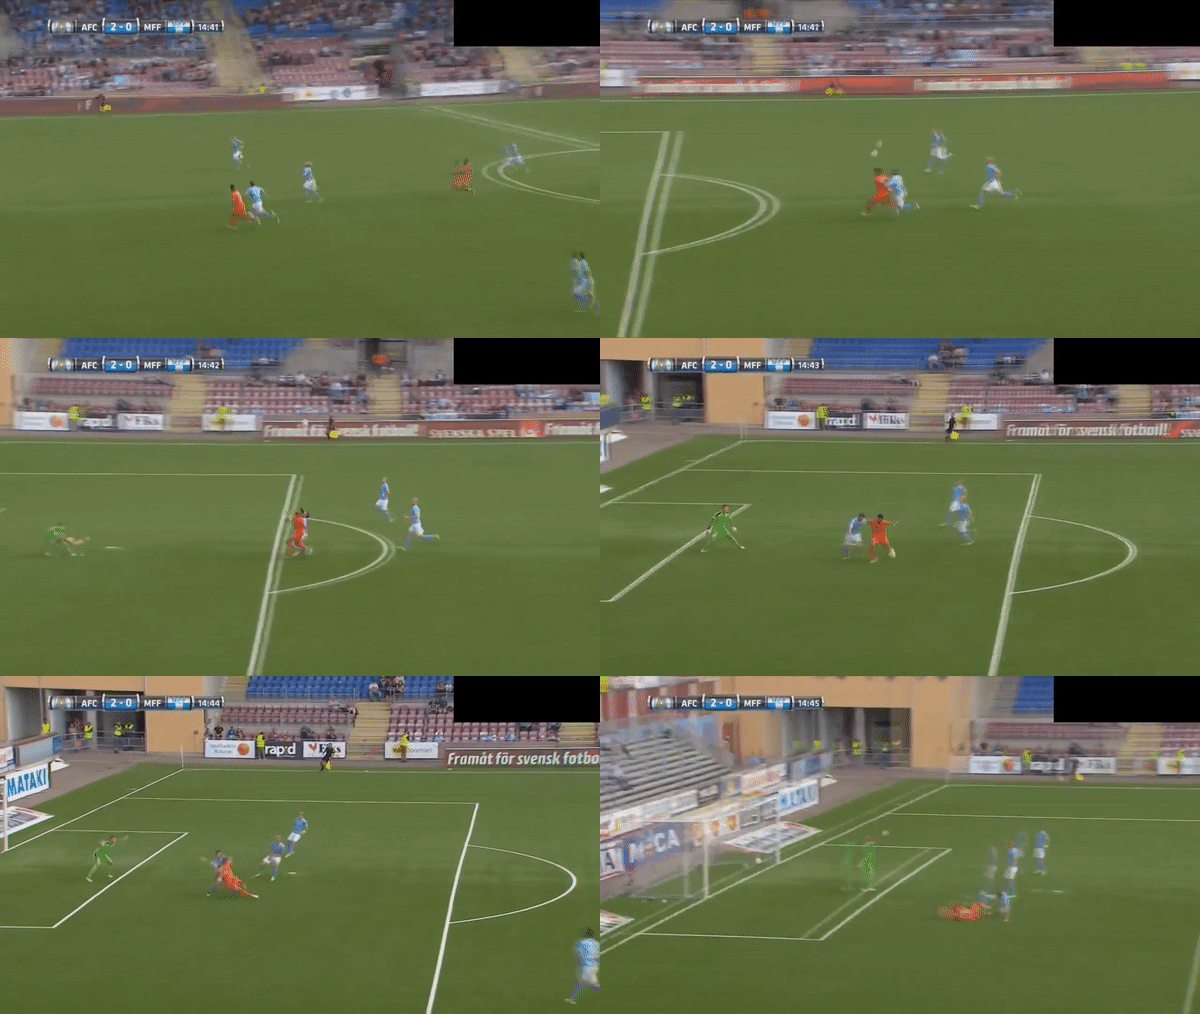
Let’s begin with two examples.


A fairly simple expected goals-model using angle towards goal and distance to the goal line assigns Paulinho’s one-on-one with the goalkeeper an xG-value of 14 %. Eddahri’s skilful, or lucky if you want, goal is rated having 17 % chance of being a goal by the same model. A more sophisticated model incorporating further features such as assist type and if it’s a direct shot or not would likely increase the xG of the first goal and decrease the value of the second to some extent. But any model that doesn’t include defensive values would have a hard time correctly judge how good these two chances are.
While I was almost done writing the code @EightyFivePoints posted something that was very similar to what I was doing. While this was a bit of a downer it at the same time proved that my approach was not that daft and I choose to post this even though it might look like straight up copying.
Code
I will likely publish some code used for this project later on my github-profile. Until then you can reach out to me on Twitter if you have any questions about this.
Data
Stratagem Technologies have supplied data for this project. It includes all open play shots finished with either foot from the top tiers of Turkey, Switzerland, Sweden, Greece, Netherlands, Austria, Australia, Norway, and Scotland as well as the second tiers of Germany and England.
This data includes, apart from coordinates, defensive pressure and number of defensive players between the finish and goal. Number of defensive players is rather self-explanatory - a one-on-one with the goalkeeper (or any other of the opposition’s players) puts this number at 1 (Paulinho’s goal above). Eddahri’s goal above have it at 2.
Angle towards goal and distance to the goal line between the posts are calculated from the coordinates. It is combinations of these four features that is used for the models.
Does a model with defensive features perform better than one without?
There is no correct way to evaluate the performance of a Logistic Regression model as it depends on what one is trying to achieve. However, AUC is useful in cases with unbalanced data and will always be a number between 0.5 (useless) and 1 (perfect). RMSE is easy to interpret and also works well when comparing multiple models using the same data.
| Features | AUC | RMSE |
|---|---|---|
| an, di, de, nu | 0.784 | 0.292 |
| an, de, nu | 0.784 | 0.292 |
| an, nu | 0.778 | 0.293 |
| an, di, nu | 0.777 | 0.294 |
| di, de, nu | 0.774 | 0.293 |
| di, nu | 0.767 | 0.295 |
| an, di, de | 0.763 | 0.297 |
| an, de | 0.758 | 0.299 |
| an | 0.755 | 0.301 |
| an, di | 0.754 | 0.3 |
| di, de | 0.753 | 0.297 |
| di | 0.74 | 0.3 |
| de, nu | 0.737 | 0.3 |
| nu | 0.729 | 0.301 |
| de | 0.57 | 0.316 |
The model using all four features scored best in both AUC and RMSE. This is evidence enough to say that Defensive Pressure and Number of Defensive Players Between the Ball and Goal has an impact on the probability of scoring. I would be lying if saying I am surprised by this though. However, I find it interesting that the differences between the models are rather small apart from when just using defensive pressure. The ranking could likely change using a different set of test data.
Comparing the model using all features with the basic model it is apparent that the probabilities are more evenly spread for the former while the sums are basically the same. This is both expected and desirable.

How is xG varying with defensive features?
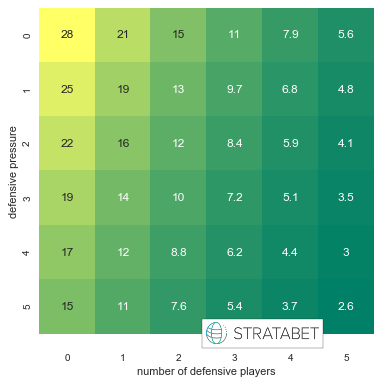
Imagine a shot being taken right in front of the goal at the line of the penalty area. The chart below illustrates how the chance of this shot being a goal would vary if defensive features were taken into consideration:

With no defensive pressure and no players there is according to the model 28 % chance of being a goal. With 3 in defensive pressure and 2 players between the ball and goal the probability has decreased to 10 % - which is the same as the basic model would assign this shot.
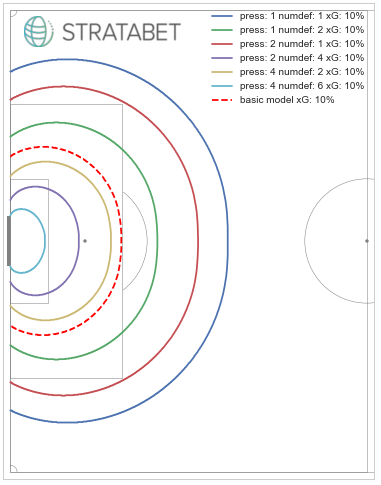
Another way to illustrate the impact of defensive features is plotting xG-thresholds on a pitch as below.

The innermost ring represents where inside a shot has to be taken to have an xG-value of 10 % or more if the number of defensive players are 6 and the defensive pressure is at 4. The outermost ring has the same xG-value but with 1 defensive player and 1 in defensive pressure. 0 defensive pressure and 0 number of defensive player’s threshold would be somewhere on the other half of the pitch. The dashed line represents the 10 % xG-threshold of the basic model.
Summary
Let’s finish with going back to the examples. The basic model gave Paulinho 14 % chance of scoring – with the defensive features this has increased to 29 %. Eddahri’s goal saw its xG decrease from 17% to 13%. Even though both shots are ending up in goal I would say that a model that rates the former’s chance as better does a better job than one that does the opposite. This alone is somewhat sloppy argumentation but I would argue that everything above together points towards that a model that takes the defence into consideration represents the reality better than one which doesn’t.
If you have come this far I would like to thank you for reading. If you have any feedback, I would very much appreciate to hear this – you can find me on Twitter. Also a big thanks to Stratagem for supplying me with the data.
This article was written with the aid of StrataData, which is property of Stratagem Technologies. StrataData powers the StrataBet Sports Trading Platform, in addition to StrataBet Premium Recommendations.